
I have installed PA Server Monitor Pro v5.1.2.58. I imported our configuration from PA Server Monitor v4.2.2.108. These installations are on different servers.
In the new installation I cannot see the reports. The area looks like this:
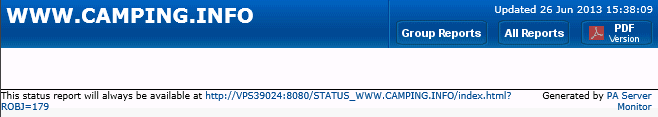 Can somebody help figure out, why the new installation on the new server does not generate the reports like on the old installation?
(I have Internet Explorer 9 installed.)
Can somebody help figure out, why the new installation on the new server does not generate the reports like on the old installation?
(I have Internet Explorer 9 installed.)
This is how the "Configure Status Report" looks like:
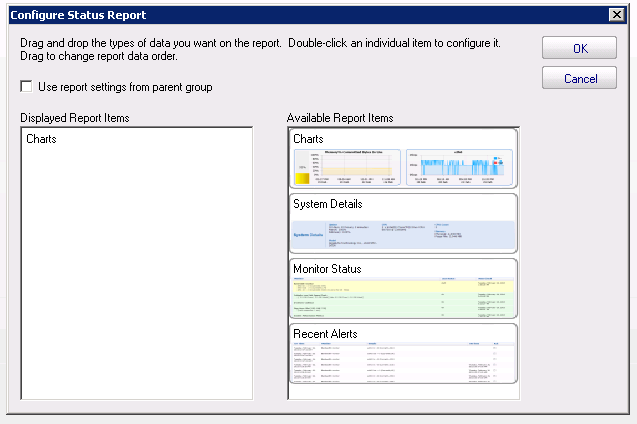 "Charts" on the left side seems to have been importet from the v4.2.2 configuration. I cannot erase it. Dragging "Charts" from the right side to the left is possible, but doesn't change the outcome - no reports shown.
