|
I have installed PA Server Monitor Pro v5.1.2.58. I imported our configuration from PA Server Monitor v4.2.2.108. These installations are on different servers. In the new installation I cannot see the reports. The area looks like this:
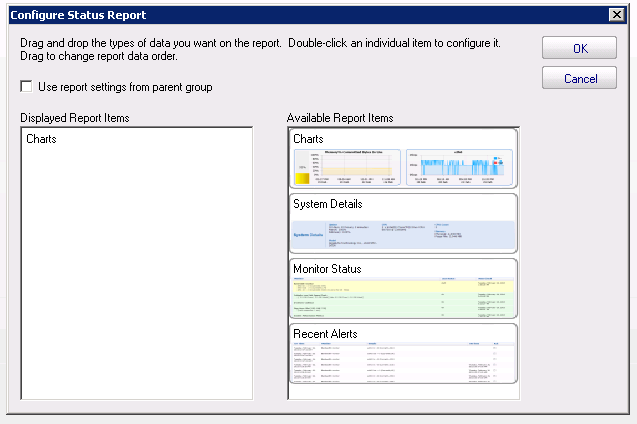
This is how the "Configure Status Report" looks like:
|
|
Hi teamaton, Are you able to open the report in IE either by clicking on the link at the bottom of the report or by selecting the Open in Browser button? Thanks After opening it in IE, it shows the same like the screenshot I posted in my question.
(25 Jun '13, 11:05)
teamaton
Quick question, do you see a server name or report name in the blue header section? Your image was cut off so I can't see the name. Also, right click on the "Servers/Devices" node and then select "Contained Server Report Settings". When the menu appears do you see any items on the left side under "Displayed Report Items"? If not, drag items from the right to the left that you want to have in your report. Save the changes and refresh your report.
(25 Jun '13, 11:19)
Quinn ♦♦
I updated the image in the question - yes I see the device name. In the "Displayed Report Items", I can see "Chart" on the left side.
(26 Jun '13, 09:43)
teamaton
Just added a screenshot of the "Displayed Report Items" dialog.
(26 Jun '13, 09:52)
teamaton
Could you send me a screenshot of the Configured Status Report menu for www.camping.info? To get that menu right click the server, select Report & Delivery Settings then select Report Settings.
(26 Jun '13, 10:37)
Quinn ♦♦
OK.. I see what what's going on. You can get everything back by dragging everything from the right to the left. I'm not sure where the text "Charts" came from but it should go away when you drag things over. If you want this report to be the same as the parent group just check the box near the top. Thanks Please make sure to mark your questions accepted when you have your answer by clicking the gray check mark to the left of the answer.
(26 Jun '13, 11:10)
Quinn ♦♦
I dragged all the items to the left. But the text "Charts" still stays there - I cannot move it to the right. I suppose the text "Charts" is there due to the import of the v4.2.2 configuration. Now I see reports "Monitor Status" and "Recent Alerts". Does it take a while before I can see "Charts" and "System Details"?
(27 Jun '13, 09:28)
teamaton
Please send us the following so that we can look to see your configuration. First, export a copy of your current config. Second, if you still have a copy of your config file from your v4.2.2.108 please include that as well. Also, does the text "Charts" show up on all of your servers or just the one, www.campinfo.com? Please send the files and information to support@poweradmin.com Thanks
(27 Jun '13, 09:38)
Quinn ♦♦
Yes the text "Charts" shows up on all servers. I will send you the config files shortly.
(27 Jun '13, 10:15)
teamaton
showing 5 of 9
show all
|

 Can somebody help figure out, why the new installation on the new server does not generate the reports like on the old installation?
(I have Internet Explorer 9 installed.)
 "Charts" on the left side seems to have been importet from the v4.2.2 configuration. I cannot erase it. Dragging "Charts" from the right side to the left is possible, but doesn't change the outcome - no reports shown.