|
Hi there I'm using PA for monitoring multiple Tomcat instances on a Windows server. My problem is, that there's apparently no way of knowing what instance is being monitored since instances is shown with an arbitrary Windows numbering (Tomcat8, Tomcat8#1, Tomcat8#2, etc.) Whenever one of the instances is restarted the numbering might change (see https://blogs.technet.microsoft.com/askperf/2010/03/29/perfmon-identifying-processes-by-pid-instead-of-instance/)
I haven't tried to change the registry so PID is added to the instance name since it won't help me out in singling out a specific named instance. I know this is basically a Windows issue but are there any work around that allows for other ways of identifying a process (like the "Command Line" shown in the Windows Task Manager).
/Rune |
|
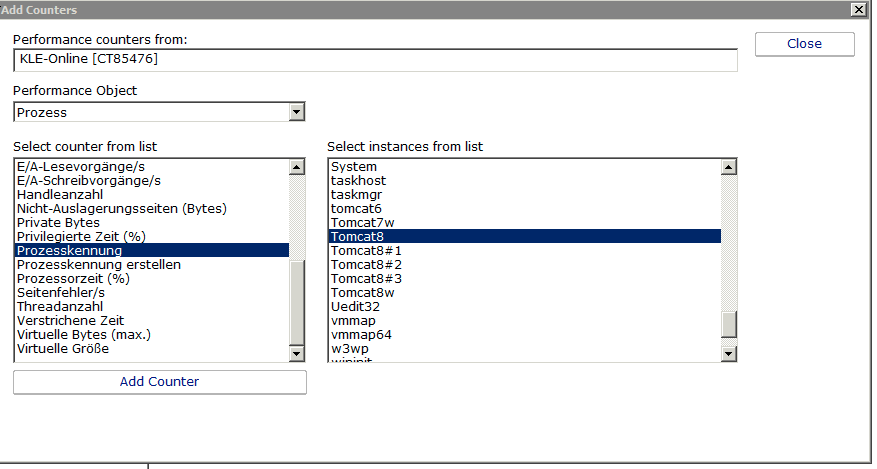
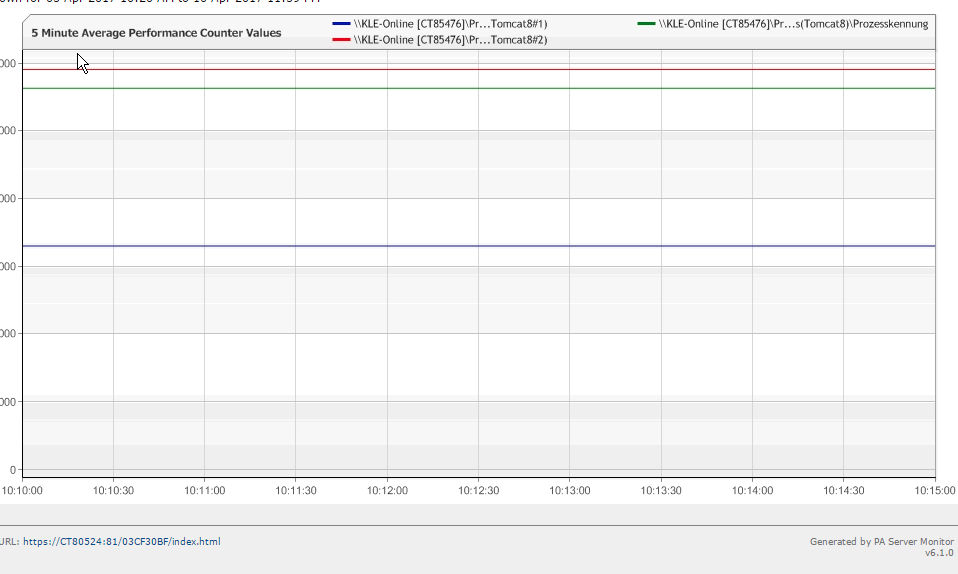
Hi Doug Thank you for the suggestion. I want to use the counters to generate a report of the memory usage of each Tomcat instance. But if I cannot see other than Tomcat8, Tomcat8#1, etc. in the report I have no way of identifying the actual Tomcat instance behind the "generic" instance name (ie Tomcat8#1), since the "generic" names might change in their references to the underlying instance. I did as you suggested and still I only see the generic names in the report view:
|
|
Are you trying to monitor all of the instances, no matter what the instance name happens to be? One thing you can do is monitor the Tomcat instance. When you add the counter and are given the thresholds to watch for, there is a little ... button at the right side of the counter path. Click that and you can directly edit the counter path. The counter path can have a * added to it, which will be expanded when the monitor runs. So you could change it to something like this: \Prozess(Tomcat*)\Prozesskennung |
|
That's a hard problem to solve since Windows doesn't map these to actual instances either. (Note that the performance counters you're looking at, including the #1 etc added to the end, are Windows counters, the same as what you'll see in Perfmon). The only way to map from a #{instance} to a PID is by also adding the ProcessID counter, as in: \Prozess(Tomcat*)\ID Prozess (I'm guessing about the German name). So if you saw high CPU on \Prozess(Tomcat#8)\Prozesskennung then you would look at \Prozess(Tomcat#8)\ID Prozess to get the Process ID for that instance. It's convoluted, but that's how Windows works :( And as you mention, these can change. So PID 10 might be Tomcat#4 and PID 12 might be Tomcat#6. If PID 12 terminates and a PID 14 starts, I'm not aware of any guarantee that PID 10 will still be Tomcat#4 - it might now be Tomcat#6. I guess you could record the ID Prozess counter so you can go back and map what instance ID maps to which PID at any given point in time. |
|
BTW - I have now tried to change the Windows registry, so the performance counter is named using this format: ProcessName_PID So far this is better than the arbitrary numbering, since at least it's constant as long, as the process is not restarted. The optimal solution where the name follows the f.ex. the service name or full command line doesn't seem to be an option. |


